Extracting Context from Every Spreadsheet


Spreadsheets look deceptively simple: rows, columns, cells. But anyone who has tried to process large or messy spreadsheets programmatically knows that the apparent simplicity hides a lot of complexity. Files can have thousands of empty columns, giant tables embedded next to notes, formulas referencing other sheets, and multiple unrelated “tables” laid out visually rather than structurally.

Ragie has been great at extracting content from typical, dense, and table-like spreadsheets. This is the type of spreadsheet that looks a lot like a database table, where each row represents a data record. Ragie iterates each cell generating a table from what it extracts. While a lot of spreadsheets fit into this rough category, there is another flavor of spreadsheet Ragie has struggled with, where the rows and columns are used to visually layout a document with multiple sections of mixed content. Our original approach attempted to treat these spreadsheets as data tables to mixed results. We knew that we could do better, but there are some important technical constraints:
- Spreadsheets can contain a lot of information so simply sending them to an LLM for classification can be slow, expensive, and will often overflow context limits
- In extreme cases a spreadsheet can have billions of cells so naive algorithms for discovering spreadsheet structure will be too slow and costly
- Spreadsheets can be a mix of document-like sections and table-like sections so the approach can’t be based around classifying spreadsheets and then applying different file level strategies
With those constraints established we began investigating options. An important feature of document-like spreadsheets we observed was that different sections tend to be separated by a region of empty cells, effectively forming “islands”. Discovering these islands and treating them as sub-sections appeared to be a promising approach, but we’d still need to address the runtime complexity issues noted above, and to do that we’d need to understand and leverage how spreadsheets store their data.
This post walks through a practical mental model for how spreadsheets actually work under the hood, and then builds up an efficient approach for segmenting a spreadsheet into meaningful regions (“islands”) of data, including optimizations for large, dense tables.
How spreadsheets actually store data
A modern Excel file (.xlsx) is a ZIP archive of XML files. For each worksheet:
- Only non-empty cells are stored.
- Rows and columns with no data do not exist in the file.
- Empty cells between populated cells are implicit, not explicit.
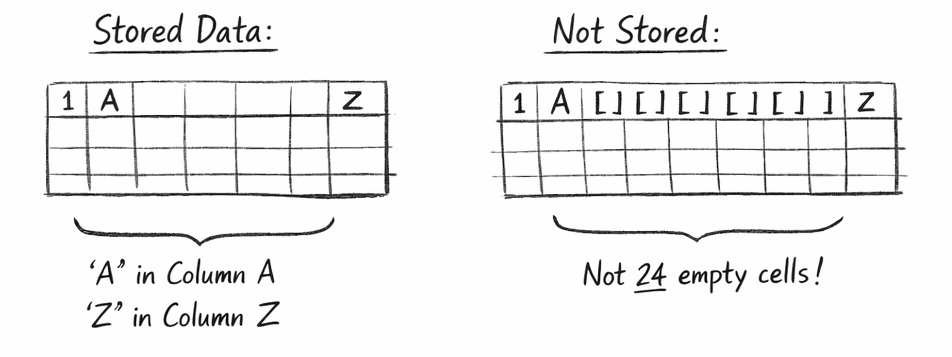
Conceptually, the file is sparse:
- A row with values in columns A and Z does not contain 24 empty cells in between.
- Those cells simply aren’t stored.
This matters because many spreadsheet-processing libraries re-materialize those empty cells when you iterate naïvely. Next we’ll dive into how 2 common python libraries for working with spreadsheets handle interacting with cells and their memory and runtime implications.
In-memory models: openpyxl vs pandas
openpyxl
openpyxl excels (get it) at reading and writing to the excel file format. It works directly with the underlying spreadsheet data.
openpyxl models a worksheet roughly as:
- A dictionary keyed by (row, column) → Cell
- Cells only exist if they were present in the file or explicitly accessed
This means
- Iterating ws._cells touches only real cells
- Iterating ws.iter_rows() over a rectangle creates empty cells on the fly
You can exploit this sparsity, but most high-level iteration APIs operate over rectangular ranges, which materializes the cells for the empty ranges ballooning memory usage.
pandas
pandas is the swiss army knife for tabular data in python. It’s used daily by data scientists, analysts, engineers, and researchers allowing them to programmatically work with tabular data. It has a pandas.read_excel method that takes a very different approach than openpyxl:
- Each column becomes a NumPy-backed array
- Missing cells are represented as NaN / pd.NA
- There is no concept of “cell objects”
The critical advantage is vectorization: operations like “find empty rows” or “drop empty columns” are implemented in compiled C/NumPy over arrays of values (vectors), not objects in Python loops.
Example:
df = df.dropna(how="all")          # drop fully empty rows
df = df.dropna(axis=1, how="all")  # drop fully empty columns
This is orders of magnitude faster than checking each cell in Python.
Why “vectorized” matters
To be clear, “vectorized” here isn’t related to the vector embeddings that frequently come up when discussing RAG. With regards to tabular data they refer to operations that work on columns or arrays of data all at once as opposed to looping over them row by row in Python. This can be a big deal because a spreadsheet can have:
- 1,048,576 rows
- 16,384 columns
Even if only a small portion is used, naïvely iterating cell-by-cell in Python is prohibitively slow. Vectorized operations let you:
- Scan entire rows or columns at once
- Perform emptiness checks in C/NumPy
- Reduce Python work to O(number of non-empty cells)
This principle underpins all efficient spreadsheet algorithms.
The island model: spreadsheets as graphs
Now that we have an understanding of how we can work efficiently with spreadsheets, let's start exploring how we can use those techniques to find the “islands” in a visually laid out spreadsheet.
We can reinterpret the spreadsheet as a graph:
- Each non-empty cell is a node
- Edges connect adjacent cells (up/down/left/right)
- Connected components are islands of data
An “island” is a maximal set of cells where you can walk from any cell to any other without crossing an empty cell.
This definition is powerful because it matches visual intuition: tables, blocks of notes, side calculations all become separate islands.
Baseline algorithm: connected components on cells
The straightforward approach:
- Find all non-empty cells (np.nonzero(mask))
- Assign each cell an index
- Use Union-Find (disjoint sets)
- Union neighboring non-empty cells
- Group by root → islands
This algorithm is:
- Correct
- Simple
- O(K) in Python, where K = number of non-empty cells
For sparse sheets, this already works well. For large dense data oriented spreadsheets it does unnecessary work and we wanted to make sure our approach is generalizable to any spreadsheets, so we started looking for further optimizations.
Optimization: row-run (interval) compression
Large tables are usually dense rectangles. In such cases, treating every cell as a node is wasteful.
Instead:
- For each row, compress contiguous non-empty cells into runs
- Each run becomes a node
- Two runs connect if they overlap in adjacent rows
Example:
Row 10: columns 1–50 filled → 1 run
Row 11: columns 1–50 filled → 1 run
Instead of 100 nodes and 200 neighbor checks, you get:
- 2 nodes
- 1 union operation
This reduces Python work dramatically for wide tables.
Run-based connected components are especially effective when:
- Tables are wide
- Tables are vertically continuous
- Gaps inside tables are rare
Even faster: the large-table heuristic
In many real spreadsheets, tables follow strong conventions:
- A dense header row
- A dense first data row
- A mostly filled rectangle below
You can exploit this with a heuristic:
- Find two consecutive dense rows
- Use their union to infer horizontal span
- Scan downward to find where density drops
- Treat the resulting rectangle as a table
- Remove it from the mask
- Repeat
This approach:
- Runs in O(width × height of table)
- Avoids any graph traversal for large tables
- Works extremely well on “human-designed” spreadsheets
It’s a cheat, but a very effective one.
Putting it all together
At high level this is the approach we landed on:
- Build a boolean non-empty mask
- Detect large tables using the heuristic to quickly extract big rectangular regions and mark those cells as “claimed”
- Process leftovers by finding run connected-components on remaining cells
- Send the identified “islands” for further classification and enrichment
By combining a realistic mental model of how spreadsheets are stored with vectorized operations, graph-based “island” detection, and pragmatic heuristics for large tables, we were able to turn messy spreadsheets into structured, meaningful regions of content, efficiently and at scale. This approach lets Ragie extract far more context from real-world spreadsheets without blowing up runtime or costs, unlocking better downstream understanding, retrieval, and generations. If you’re building systems that need to truly understand documents of all shapes and sizes, that’s the kind of problem we work on every day at Ragie.